


 by Scott W. Barnhart, Ph.D and Cora M. Barnhart, Ph.D
The Immigrant Investor (EB-5) Program was created in 1990 to encourage immigrants wishing to reside in the United States to invest capital in a new commercial enterprise in order to create new and permanent fulltime jobs. Immigrant investors in the EB-5 program are normally required to invest $1 million in regional center projects, unless the project is located in a Targeted Employment Area (TEA), which allows a reduced investment level of $500,000. So the question arises, just how much does an immigrant investor’s $500,000 expenditure, along with household and other expenditures impact the local economy? Moreover, what are the broader economic effects one can glean from this analysis if the individual investor impacts are extrapolated to reflect national trends in EB-5 immigration?
This article provides a case study of an immigrant investor’s $500,000 investment in the construction and operations of a hypothetical hotel project (one of the most common EB-5 projects) in Los Angeles, CA. It further generalizes these findings by applying the results to recent national immigrant statistics. The study uses the IMPLAN v3 (MIG, Inc.) input-output modeling software and associated regional data for the Los Angeles-Long Beach-Riverside Combined Statistical Area (LA-CSA) to analyze the impacts of the investor’s $500,000 investment, household expenditures and other related relocation expenditures on the local economy. The article examines the impact of these expenditures on jobs, contribution to Gross Domestic Product (GDP), and federal, state, and local tax revenues.
EB-5 Investment Effects
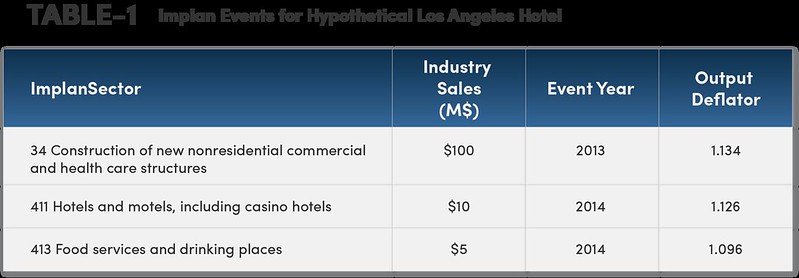
One must first identify a project in which the immigrant’s $500,000 will be invested in order to determine the impact that the immigrant investor’s expenditure will have on a local economy. Therefore, we begin with a hypothetical hotel project in Los Angeles seeking EB-5 funding. This typical EB-5 project consists of a construction hard cost budget of $100 million, which is assumed to be in the second year of a 24-month timeline in 2013, so all jobs—direct, indirect, and induced—are considered. In addition, the hotel has $10 million in annual gross operating revenues and a full service restaurant with $5 million in annual revenues, both occurring in 2014. Table 1 presents the IMPLAN events representing the three industry sectors, along with the event years and deflators: 34-Construction of new nonresidential commercial and health care structures, 411-Hotels and motels, including casino hotels, and 413-Food services and drinking places.
It is useful to look at the multipliers associated with each activity in more detail to better understand the number of jobs created within each industry sector. The employment final demand multipliers consist of three main effects: direct, indirect, and induced, representing the jobs created per $1 million spent. The change in employment in an industry per million dollars spent in that industry is measured by the direct effects multiplier. The number of jobs created directly from a $1 million investment is shown in Table 2, ranging from 6.9 jobs for construction to 16.42 for food services. The response by all local industries caused by inter-industry spending is the indirect effects multiplier, ranging from 2.43 to 3.3 jobs per $1 million invested. Finally, changes in household and government spending, as income is generated from the direct and indirect effects, create the induced effect. Additional jobs from this impact range from 11.19 to 12.47 jobs. Adding together the three effects results in the total effects multiplier, which represents the total number of jobs created per $1 million dollars spent. These effects range from 20.6 for construction to 30.8 for restaurants, implying for example, that for every $1 million dollars of gross revenues earned in the restaurant industry, 30.8 jobs are created in the local economy.
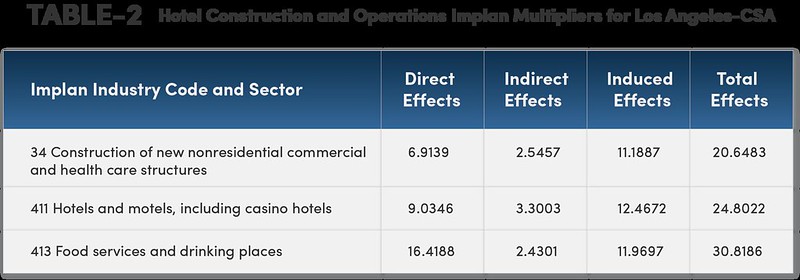
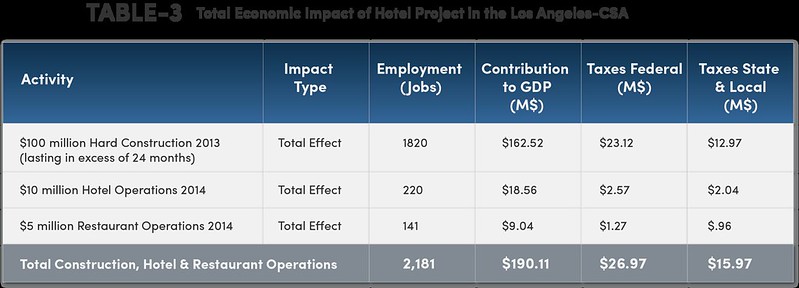
Using the dollar expenditures and output deflators (to deflate the expenditures to the 2010 data year) in Table 1, and the total effects multipliers from Table 2, one can see the total impacts of the hotel project on the local economy. Table 3 shows the impacts of construction and operations of the hotel and restaurant in the LA-CSA. A total of 2,181 new jobs are created with an associated $190.11 million contribution to GDP. In addition, $26.97 million is generated in federal taxes and $15.97 million is generated in state and local tax revenues. The $100 million spent on construction in 2013 creates 1,820 jobs, while the $10 million of gross revenue from hotel operations in 2014 will create 220 jobs, and finally the $5 million of restaurant operations in 2014 will generate 141 jobs.
The Code of Federal Regulations states that an immigrant’s investment must create at least 10 jobs, so the results from Table 3 imply that up to 218 (2,180/10) immigrants can invest in the project, allowing the project to raise $109 million (218*$500,000), assuming the project is located in a Targeted Employment Area (TEA). In addition, depending upon which tranche or phase of the project the immigrant’s investment is placed in, the investor’s funds can support construction, hotel operations or restaurant operations. Each of these sectors will create a different jobs impact because the multipliers differ across industry sectors. Table 4 provides the results of an investment of $500,000 in each of the three activities associated with the hotel project and the average total effect across all industry sectors.
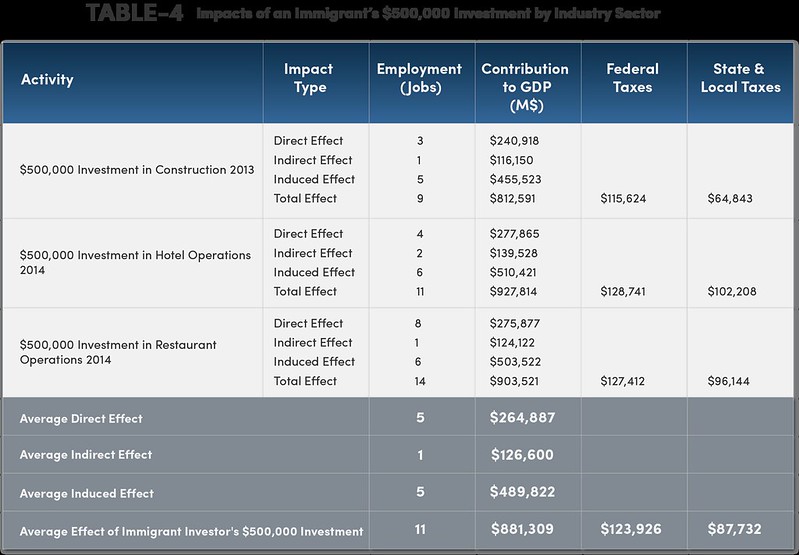
The $500,000 investment creates nine total construction jobs, or 11 jobs in hotel operations, or 14 jobs in restaurant operations. On average, across all industry sectors, 11 jobs are created, with contributions to GDP totaling $.881 million. Additionally $.12 million and $.087 million are collected in federal, and state and local tax revenues, respectively. Note that even though the program stipulates that 10 jobs must be created per $500,000 investment, and the multiplier for construction is 20.64 (Table 1), implying 20.64 jobs are created per $1 million spent, due to the effects of the lower $500,000 investment and the deflators, only nine jobs are created in construction. If the construction timeline was less than 24 months, such that only indirect and induced jobs are counted, the $500,000 investment in construction would create only six jobs.
Household and Other Expenditure Effects
In addition to the $500,000 investment, immigrant investors also stimulate the economy through household and other related expenditures. EB-5 investors must qualify as accredited investors, which federal securities laws define as: “a natural person with income exceeding $200,000 in each of the two most recent years or joint income with a spouse exceeding $300,000 for those years” (Rule 501 of Regulation D). Thus the $300,000 joint household income with a spouse is a minimum qualification. A recent study on the national impacts of the EB-5 program conducted by Kay, Thorvaldson, and Lindall (2013) assumed an average tax rate of 15 percent and a savings rate of 10 percent. Applying these tax and savings rates to the $300,000 income figure results in a net household income of $225,000 for this case study.
Kay, Thorvaldson, and Lindall (2013) also document other immigrant investor expenditures in 2011 related to moving to, and living in, the United States. Adjusting their 2011 figures for inflation to 2013, and putting these expenditures on a household basis, results in the following dollar amounts: automobiles ($30,066), moving ($9,385), travel ($2,488), fees related to airports ($7), investments ($23,764), attorneys ($51,660), and government immigration fees ($11,324).
Examining the $225,000 net household expenditures, and other related moving expenses cited above, using the IMPLAN LA-CSA model, results in the estimates in Table 5.
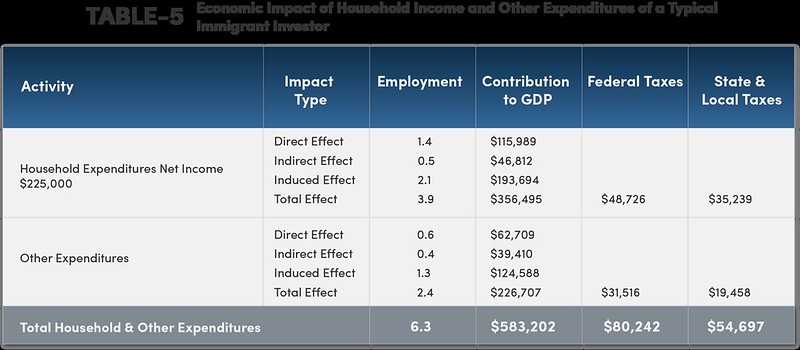
Household expenditures by the investor create four jobs, while other expenditures generate an additional two jobs, resulting in a total of six jobs. Likewise, the combined contribution to GDP is $583,202—$80,242 is generated in federal taxes, and $54,697 in state & local taxes.
So what is the total combined impact of the immigrant investor’s $500,000 investment, along with household and other moving related expenses in this case study? Table 6 presents the combined results of these three expenditure patterns.
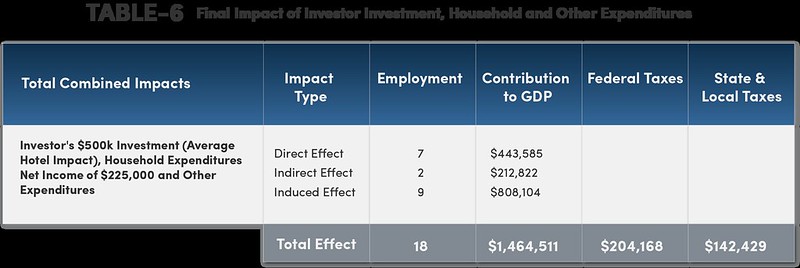
The direct effect of the investor’s investment and personal consumption spending is seven jobs and $443,585 contributed to GDP. Indirect and induced effects of the investor’s spending include two and nine jobs, and $212,822 and $808,104 contributed to GDP. Thus, the investor in this example creates a total of 18 jobs, contributes $1.46 million to GDP, and increases federal and state & local tax revenues by $204,168 and $142,429, respectively.
A total of 2,695 visas were approved in 2012 by the U.S. Department of State (Kay et al., 2013). Given that an average household size is 3.07 (Homeland Security), there were approximately 878 new immigrant households in 2012. Multiplying the individual immigrant investor results cited above by the number of immigrant households implies that, if all investor projects were in the LA area, the EB-5 program created 15,541 new jobs, contributed an additional $1.286 billion to GDP, and generated $179.26 million and $125.05 million in federal and state and local tax revenues, respectively. The figures from this case study are surprisingly similar to Kay, et al., who estimated an annual average of 16,674 jobs, $1,325 billion contribution to GDP, and $173.40 million and $109.22 million in federal and state/local tax revenue.
Escalating these figures to account for projected or anticipated increases in visas issued in the United States results in the figures reported in Table 7. For example, an increase in the number of visas issued to 6,000 per year could create 34,593 new jobs, contribute $2.86 billion to GDP, and generate an additional $399.02 million and $278.36 million in federal and state & local tax revenue.
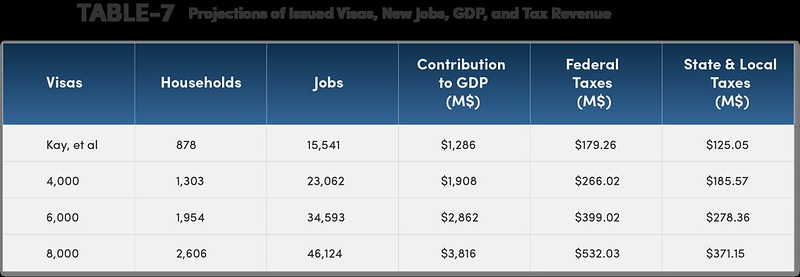
One final point to note is that the impacts from each new wave of immigrant investors coming to the United States each year is a new and distinct economic event. This, of course, implies that the economic impacts cited above would be additive over time as new immigrants enter the United States. For example, if 6,000 visas are issued over the next ten years and, assuming the investments and household expenditures are as outlined above, up to 345,928 jobs could be created with a corresponding contribution to GDP of up to $28.62 billion (in 2013 dollars). Therefore, the effects of the EB-5 program are indeed quite large.
Literature and Information Sources Cited
Kay, David, Jennifer Thorvaldson, and Scott Lindall. 2013. Economic Impacts of the EB-5 Immigration Program (2010-2011), 3rd Annual IIUSA EB-5 International Investment & Economic Development Forum.
Minnesota IMPLAN Group, Inc. (MIG). Impact Analysis for Planning (IMPLAN) , Version 3.0, Economic impact modeling system and regional data, Stillwater, MN, October, 2010, available at www.implan.com.

DISCLAIMER: The views expressed in this article are solely the views of the author and do not necessarily represent the views of the publisher, its employees. or its affiliates. The information found on this website is intended to be general information; it is not legal or financial advice. Specific legal or financial advice can only be given by a licensed professional with full knowledge of all the facts and circumstances of your particular situation. You should seek consultation with legal, immigration, and financial experts prior to participating in the EB-5 program Posting a question on this website does not create an attorney-client relationship. All questions you post will be available to the public; do not include confidential information in your question.
