
By Ismael Fernandez
The EB-5 industry has been shaken by the somewhat unexpected changes taking place this summer. The ruling on June 23 in the Behring Regional Center, LLC v. Chad Wolf in Northern California to vacate the Modernization regulations introduced by the USCIS in November of 2019, caused a spike of demand for EB-5 projects. However, the expiration of the Regional Center program a mere week later truncated such demand while paralyzing the majority of all I-526 pending applications and introducing a level of uncertainty without precedent in the EB-5 industry. While hoping the reauthorization is taken with priority in Congress, we can take a look back and learn about the EB-5 demand and other statistics, since the Modernization regulations took effect in November of 2019.
We can only rely on the data provided by the USCIS[1] and the Department of State during this period of 18 months to understand the real demand for EB-5 visas; where the demand is coming from, and how much the processing times have changed over time. Needless to say, 2020 has been a special year on its own due to the international restrictions imposed as a consequence of the global pandemic, but data is always welcome to drive good policy and improvements in the EB-5 adjudication process.
I-526 Statistics for EB-5
The number of I-526 filings received by the USCIS in the first half of Fiscal Year 2021[2] has amounted to a total of 189, which is approximately double the average rate received in the previous three quarters. It is hard to arrive to conclusions about why this effect took place in the last two quarters, but it is possible that it is related to the fact that now, more than in recent history, the economic uncertainty in the world has increased significantly and investors are now looking at the U.S., as a robust economy and a place to live with political and economic stability.
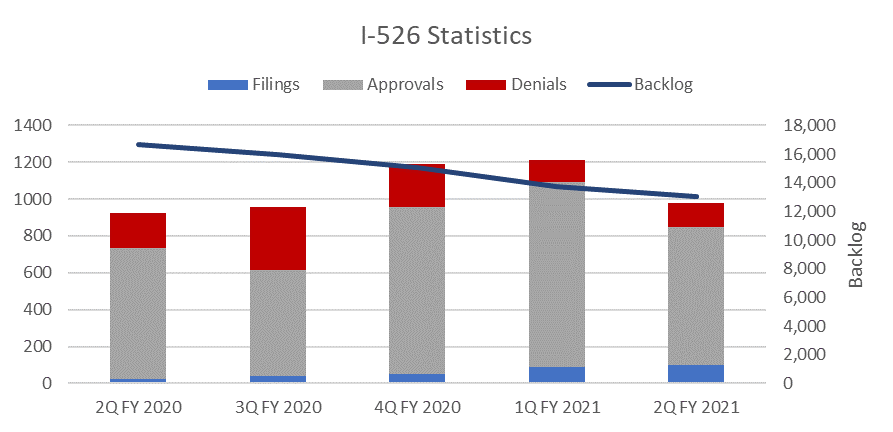
When looking at the number of Approvals and Denials, it is noticeable that the USCIS has not been as productive during 2Q FY 2021 as in the previous two quarters. For reference, the USCIS processed above 1,100 I-526 per quarter in 4Q FY 2020 and 1Q FY 2021, compared to over 880 applications in the latest period. This hasn’t prevented the USCIS from being able to reduce their backlog, which it seems to be doing at an average rate of 900 cases per quarter. Assuming that somehow this trajectory continued over time, it would take the USCIS approximately 3.6 years to catch up.
In terms of approvals, I-526 adjudications have improved significantly to above 85% in the last period from a low of 63% in 3Q FY 2020. This seems like welcoming news after we have seen (purely based on experience) a significant increase in requests for evidence (RFE) in 2020.
I-829 Statistics for EB-5
With the exception of 1Q FY 2021, the filing of I-829 applications has increased from 600 in 2Q FY 2020 to over 1,000 in the last period. The productivity of the USCIS has remained steady, processing between 600 and almost 800 filings per quarter, with 2Q FY 2021 being the least productive period – just as it was the case with I-526 adjudications.
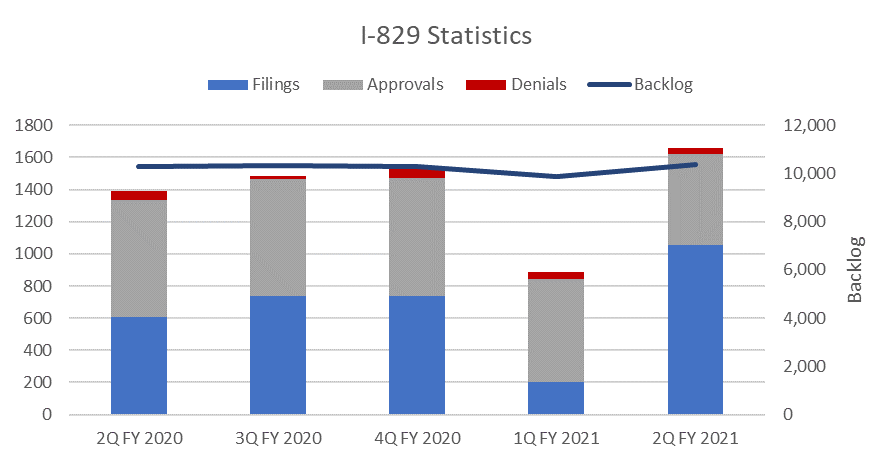
The backlog of I-829 pending cases remained fixed at just over 10,300 for most periods, except for 1Q FY 2021. This will potentially be an issue as the number of I-829 cases is predicted to increase over time following the high demand of I-526 filings in 1Q FY 2019 prior to the introduction of the Modernization regulations. In terms of approvals, the I-829 adjudication process enjoys the highest rates of all the filings, with well over 90% approval ratings with no clear trend to move away from such average.
I-924 Statistics for EB-5
Perhaps one of the most revealing charts of this analysis is the trends observed with Regional Center petitions. It seems like after the USCIS introduced the Modernization rules in November 2019, there hasn’t been any meaningful data associated with the filing of new Regional Centers. Yet, the backlog seemed to increase in 4Q FY 2020 without much explanation.
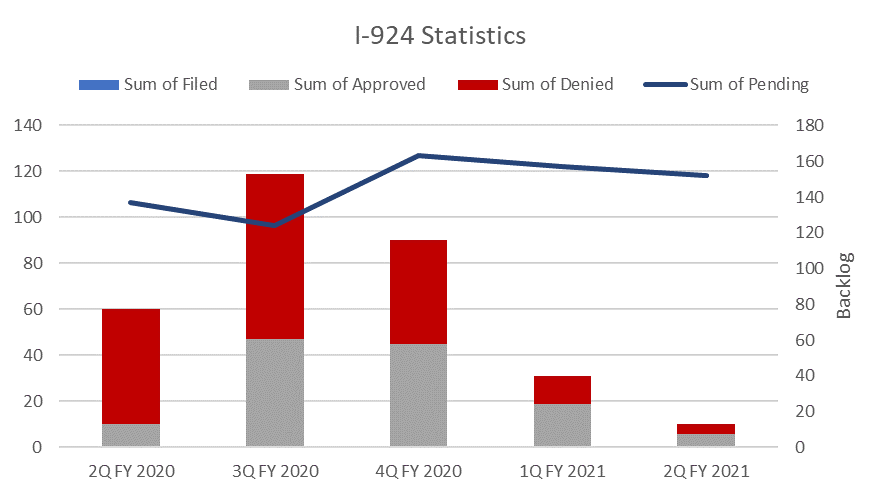
In addition, the USCIS has been processing less I-924 applications per quarter to such a low level that makes you wonder if the USCIS already knew that the Regional Center program was going to lapse ahead of time. With a backlog of 152 pending I-924 applications, and a processing rate of just ten per quarter, the latest measured, the USCIS should be completed with the processing of I-924s in almost four years. What makes this chart even more alarming is that the approval rates of I-924s are the lowest of all three filings by far. Although it has improved in the last two quarters, to approximately 60%, the low number of cases processed in the same period, make that improvement statistically irrelevant. The approval rates of the previous three quarters, with between 60 and 119 cases processed per quarter, ranged between 17% and 50%.
Processing Times for the EB-5 visa
Timing is everything, and the EB-5 industry is known for taking patient investors willing to wait years before hearing back from the USCIS. None of the three filings analyzed here are particularly known for their quick processing time. What makes these metrics interesting is that they are very hard to measure in real life; we can only query the USCIS expected times through their website, as the USCIS does not post actual times per adjudicated case to the public. The figure below shows the trends for the three different filings.
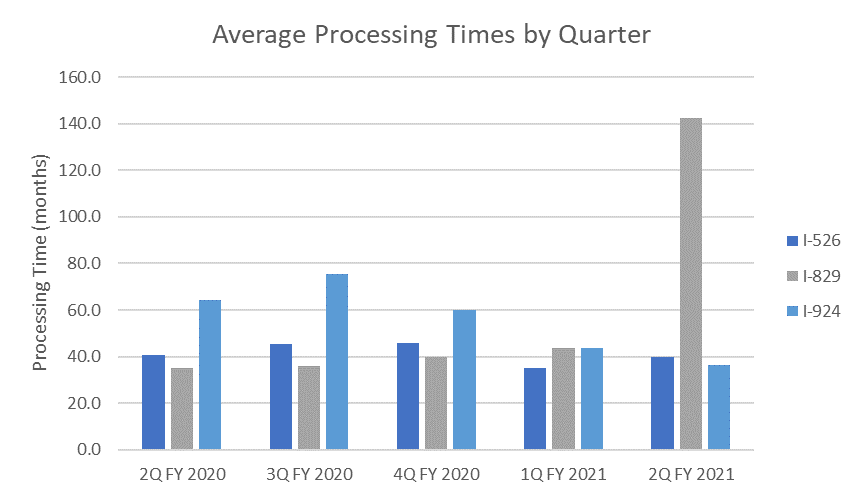
While there is a spike in I-829 processing times during the last period, the timescales reflected here are at the last date of the quarter available. It has been observed that the estimate provided by the USCIS[3] for the I-829 filing is quite volatile and has a range that is more than double the average. It was found that wait time data from 2Q FY 2020 to 1Q FY 2021 ranges from 22 to 248 months. It is clear, based on the long wait times and adjudication periods, that the USCIS seems to have an asset allocation problem that should have been somewhat eased with the lapse of the EB-5 Regional Center program, which in FY 2020 represented approximately 91% of the cases. We hope they take this opportunity to improve their backlog of EB-5 Direct cases and fast track the new ones.
[1] USCIS Immigration and Citizenship Data Page, accessed on 18th August of 2021: https://www.uscis.gov/tools/reports-and-studies/immigration-and-citizenship-data
[2] Federal Fiscal Years end on September 30th.
[3] Data provided by the USCIS and collected by IIUSA. Accessed in August of 2019. https://iiusa.org/eb5_processing_times/
DISCLAIMER: The views expressed in this article are solely the views of the author and do not necessarily represent the views of the publisher, its employees. or its affiliates. The information found on this website is intended to be general information; it is not legal or financial advice. Specific legal or financial advice can only be given by a licensed professional with full knowledge of all the facts and circumstances of your particular situation. You should seek consultation with legal, immigration, and financial experts prior to participating in the EB-5 program Posting a question on this website does not create an attorney-client relationship. All questions you post will be available to the public; do not include confidential information in your question.